“If you can’t measure it, you can’t manage it.”
If you're nerdy like me, I bet you’ve heard this one from Peter Drucker, one of the best-known thinkers and writers on the subject of management theory. And maybe that’s why you’re here: You know that growing on TikTok isn’t just about posting videos — you need to dig into the data to see what actually works.
But the first time you opened the TikTok analytics tab probably felt like staring at a spaceship dashboard. Numbers, charts, percentages … Where do you even start?
The good news is that you don’t need to measure everything; it’s more important to measure the right things based on your goals. That's where the real insight lives: focusing on the metrics that actually tell you something about your audience, your content, and your growth.
Key takeaways
- Choose metrics based on your goal: Focus on views for reach, watch time for retention, engagement for interaction, and follower growth for audience growth.
- Multi-platform access: Use the mobile app for quick checks and the desktop dashboard for more detailed data exports and deep-dive analysis.
- Audience insights: Use demographic data and "most active times" to schedule posts when they're most likely to reach people.
- Creative feedback loop: Use analytics to identify patterns in top-performing videos (length, hooks, and themes) to inform your future strategy.
Jump to a section:
What are TikTok analytics?
TikTok analytics is the data in your TikTok account that provides insights into how your content performs on the platform. Your analytics help you understand who your audience is, what content they engage with, and when they are most active.
When you have these numbers, you gain the knowledge to create even better content, get more eyes on it, grow your audience, and maybe even make some money.
How to access analytics on your TikTok account
Before you dive in, a quick note: The TikTok analytics dashboard is available to Creator and Business accounts. If you're still on a personal account, you can switch for free in Settings and privacy → Account → Switch to Business Account (or Creator). Also worth knowing: You'll need at least 100 followers to unlock some features, like the Followers tab.
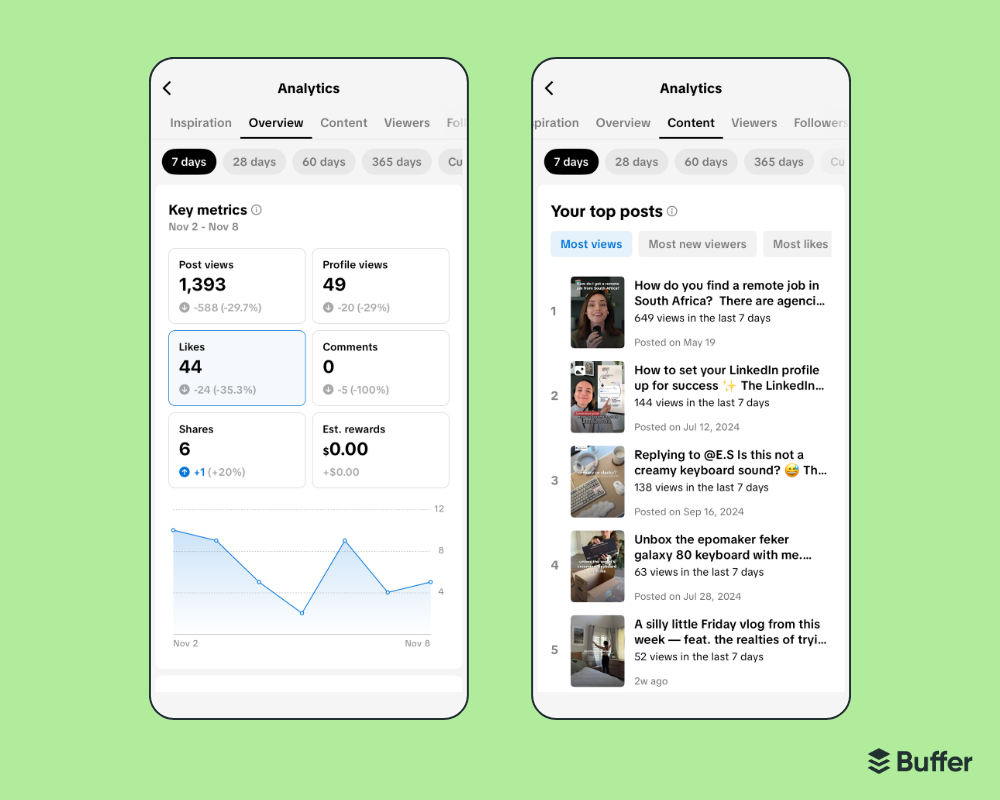
On the mobile TikTok app
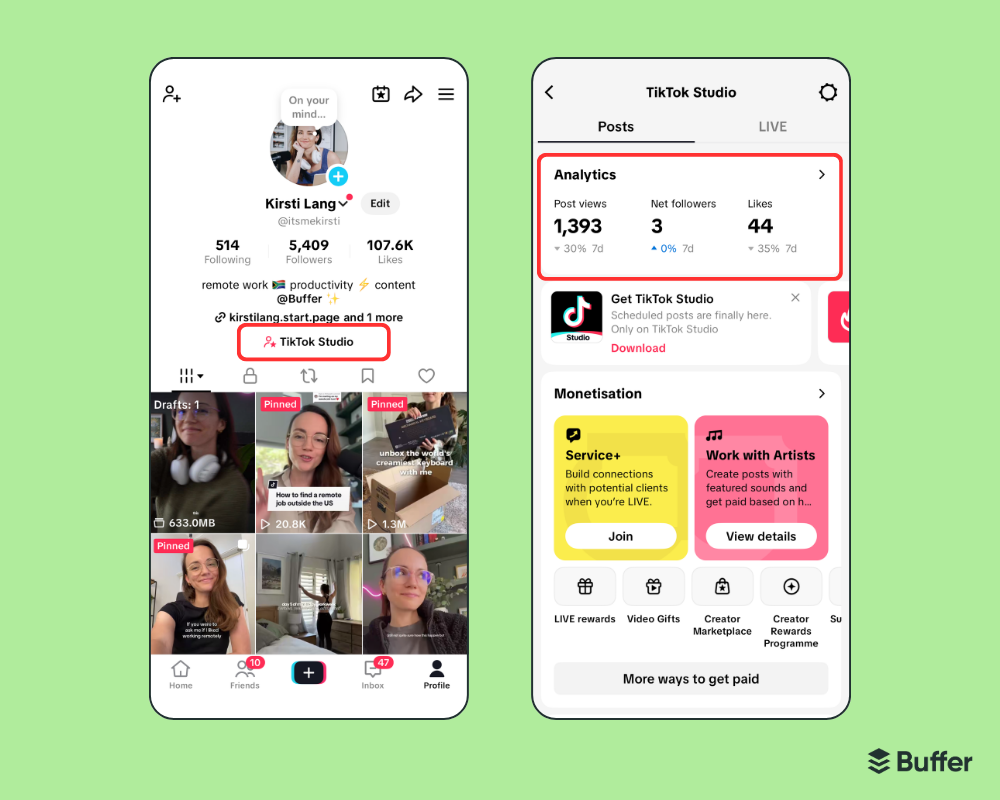
- Open the app and navigate to your TikTok profile (in the bottom right-hand corner).
- Right below your bio, click on the TikTok Studio button.
- Click on Analytics.
- Scroll through the tabs at the top to explore your stats.
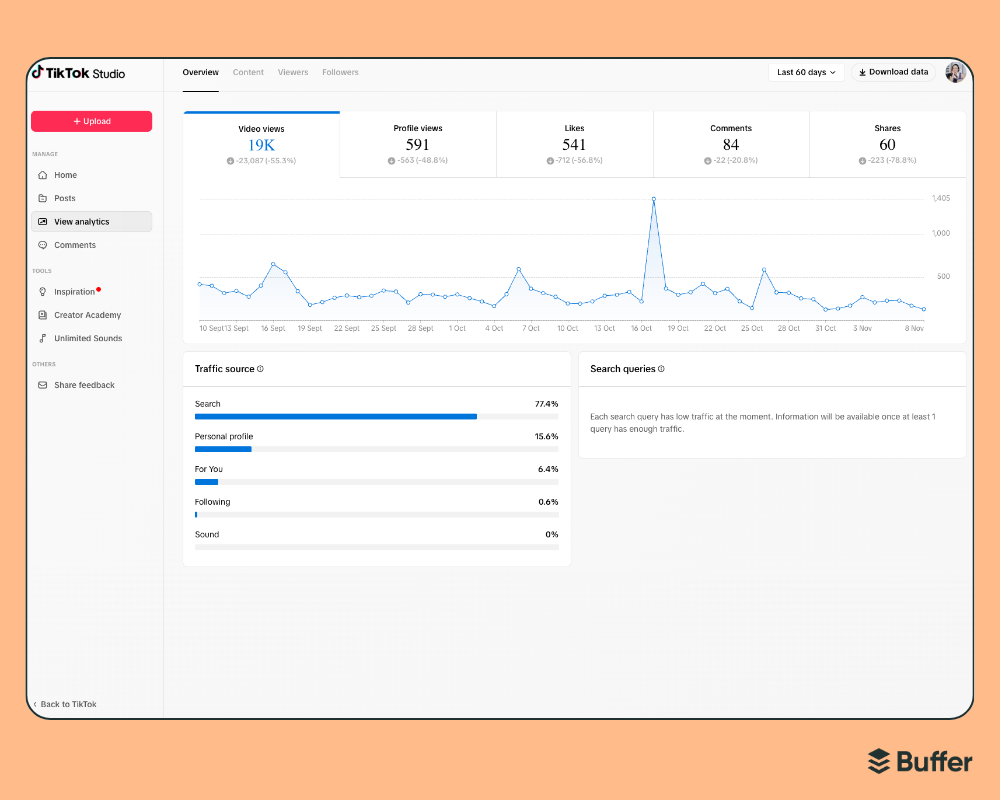
On TikTok's desktop site
TikTok analytics on mobile vs. desktop
The stats you’ll see look a little different on each device. Here’s what you can expect:
Which platform should you use?
- Mobile: You want to check stats quickly, on the go, or keep tabs on trends while filming and posting content.
- Desktop: You want to dig into the numbers, export data, and plan content in more detail.
How to access TikTok analytics in Buffer
If you're managing your TikTok alongside other platforms, Buffer Insights gives you a clean, per-channel view of your performance (follower growth, engagement, impressions, and a Performance per Post breakdown), so you're not jumping between tabs trying to piece it all together. The AI-powered Takeaways are especially handy if you're short on time and just want to know what to do next.
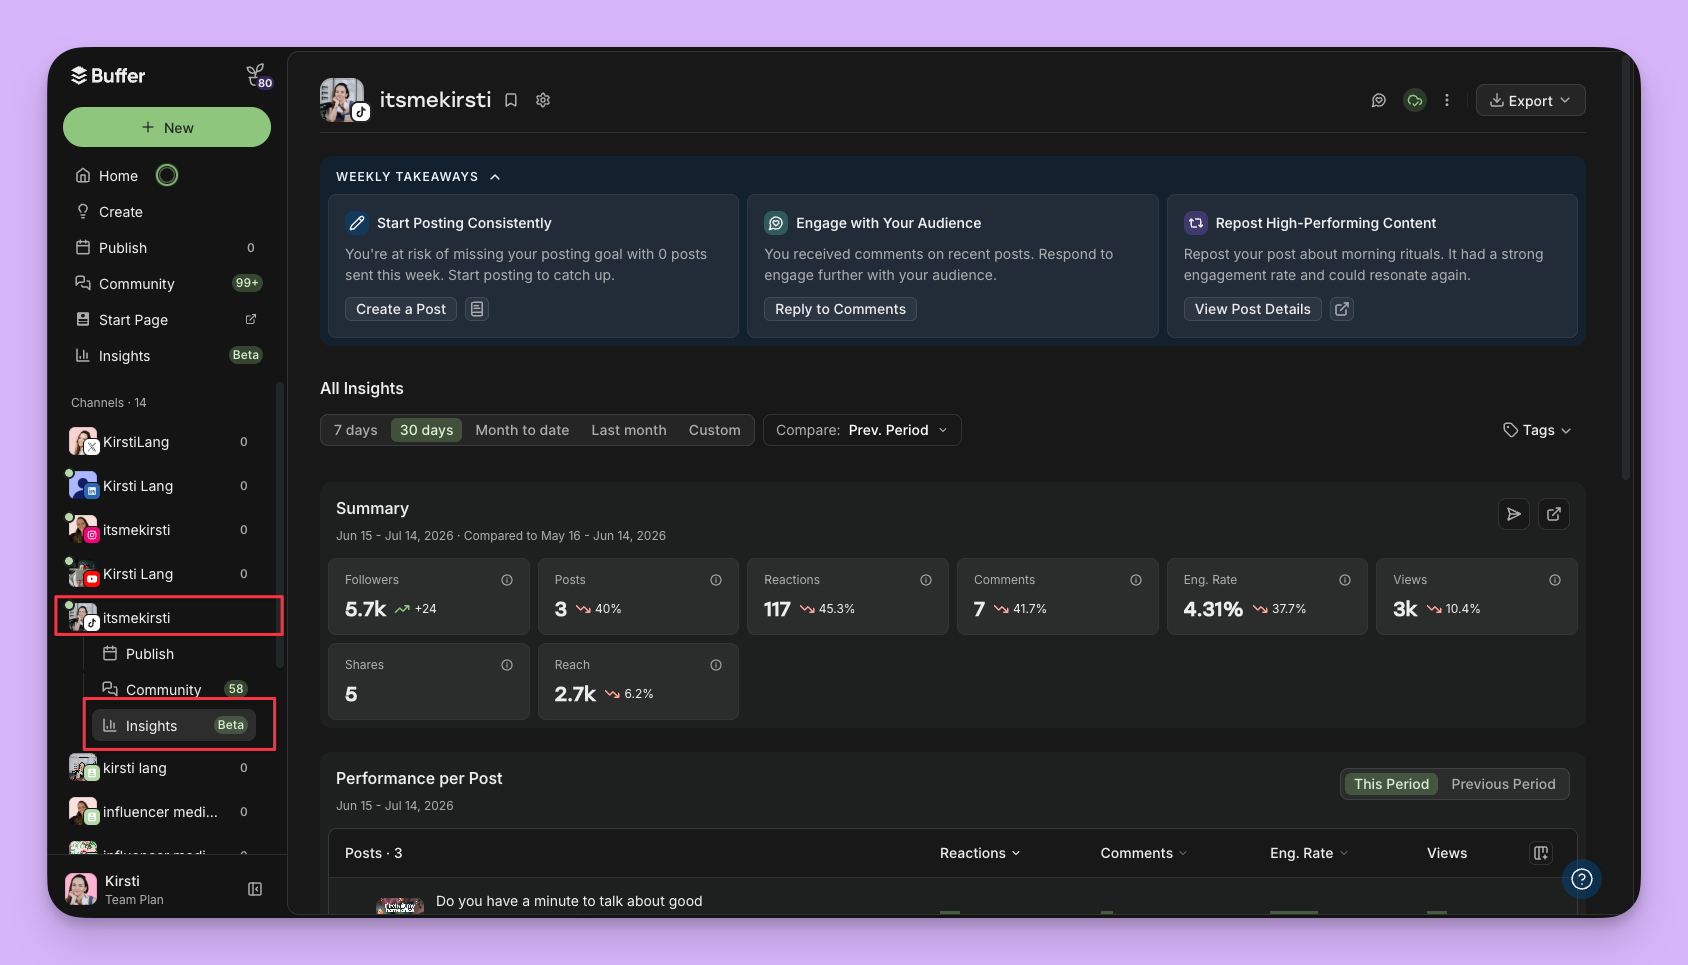
Here's how to find your Buffer Insights:
- Open your Buffer dashboard.
- In the left sidebar, select TikTok, then click Insights beneath the channel name.
- Use the date range and filters at the top to set the period you want to review.
The 4 main sections on your TikTok analytics dashboard
TikTok organizes its native analytics into four primary sections:
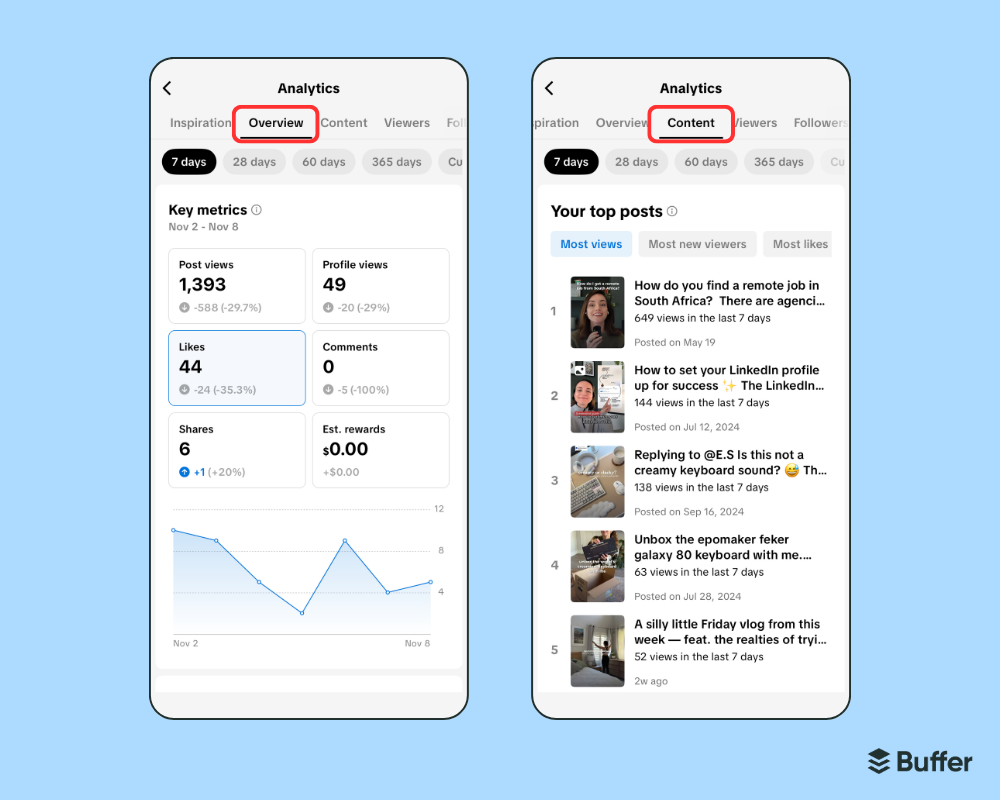
- Overview
- Content
- Followers
- LIVE
Note: Although the four sections remain the same, the depth and focus of the data can vary between Creator and Business TikTok accounts:
Overview
The overview is a high-level snapshot of how your TikTok account is doing.
- Video views: The total number of times your videos were watched in your selected time frame.
- Profile views: How many times users visited your profile, which is a good signal of interest beyond just viewing videos.
- Follower growth/loss: How many new followers versus unfollows in that period.
- Engagement counts: See your likes, comments, and shares.
🎯 How to use it
Think of the Overview as your dashboard for “how am I doing overall?” If you notice a big spike or drop here, it’s a signal to dig deeper.
Content
This tab zooms in on how individual posts are performing. Key metrics to watch include:
- Average watch time: How long viewers stay watching your video on average. (If this is low, your hook or intro might need work.)
- Total play time: Total minutes/hours people spent watching your videos.
- Reached audience: How many unique users your video was shown to.
- Watched full video: The percentage of viewers who watched your video all the way through. A high completion rate can be a useful signal that viewers are finding the video engaging.
- Video views by section/source: Did people find your video via the For You page, via your profile, or somewhere else?
- Trending videos: The top videos with the fastest growth in views or engagement recently.
🎯 How to use it
You can use this tab to identify what kind of posts are working right now. For example, if videos with certain themes or hooks are trending, lean into them.
Heads up: Some of these individual post metrics are only available for the past seven days, so it's a good idea to check in regularly so you don't miss anything.
Followers
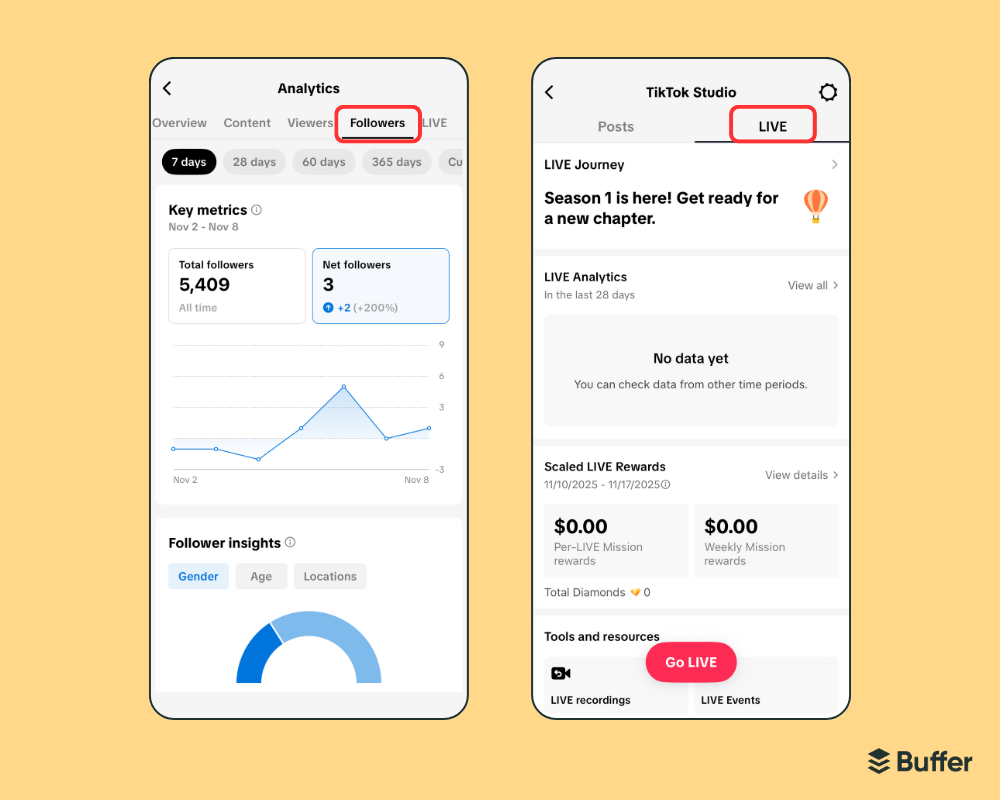
Here you can learn all about your audience — who they are, when they’re active, where they’re from, and more. (One thing to note: you'll need at least 100 followers before TikTok populates this tab with data.)
- Total followers and net followers: How many people currently follow you, and how many gained/lost in your selected period?
- Demographics: Age groups, gender breakdown, top countries/cities where your followers are based.
- Most active times: What hours/days are your followers most active on TikTok?
🎯 How to use it
Use follower data to guide your content strategy and posting schedule. For example, if you see many followers in a certain city/time zone, adjust your timing accordingly. If you have a strong age/gender segment, tailor visuals/language to them.
LIVE
The LIVE tab is for when you host live-stream sessions on TikTok. It gives you data specific to those live streams so you can understand how your live audience engages.
- Total views on your live sessions: How many people watched your live broadcast?
- Unique viewers: How many individual accounts watched (even if they drop in and out).
- New followers gained during live: Useful to gauge how effective the live session was at converting viewers to followers.
- Top viewer count: The highest number of concurrent viewers during the live.
- Diamonds / virtual gifts: If applicable in your region, this counts how many gifts you received.
🎯 How to use it
Treat your live metrics like feedback on your real-time event. If you notice a drop-off at a certain minute, maybe the format needs tightening. If many new followers came in during the live, consider replicating the hook or format.
5 key metrics to focus on
Here are my top five metrics and what to do with them:
1. Video views
👀 What to look at: How many people are watching your videos?
💡 Action tip: Notice which videos get the most views and make more like them.
2. Watch time
👀 What to look at: How long viewers are sticking around for your videos. Are they watching all the way through, dropping off early, or rewatching parts?
💡 Action tip: If watch time is low, experiment with hooking viewers in the first two to three seconds, tightening edits, or making your content more engaging.
3. Follower growth and followers per video
👀 What to look at: How your audience changes week by week.
💡 Action tip: Track patterns: What content makes people follow you? Do more of that.
4. Engagement
👀 What to look at: Which videos people interact with most.
💡 Action tip: Pay attention to shares as they show what content people want to spread.
5. Follower insights
👀 What to look at: Age, location, and when your followers are online.
💡 Action tip: Post when your audience is most active and tailor content to who they are.
How to use your TikTok analytics to improve your content strategy
Your analytics are a great place to understand what content is resonating with your audience and where you can improve.
For example, if you notice one video has a lot more shares and saves, dissect why. Does it share unique information that’s not readily available? Is it something people might want to reference later and share with their friends? What are the comments like? Can you create more content around the same topic?
When you treat your analytics as a creative feedback loop instead of a performance scorecard, you start to see patterns that help you grow faster (and smarter).
Here’s how to make the most of your TikTok analytics.
Define your TikTok goals
Analytics are only useful if you know why you're measuring them. Before you start digging into dashboards, get clear on what you're trying to achieve. Here are a few common TikTok goals and the metrics that map to each:
- Grow your audience: Track follower growth, profile views, and followers gained per video.
- Boost engagement: Focus on likes, comments, shares, and saves (especially shares, which signal that people want to spread your content).
- Improve content quality: Watch your average watch time and full-video completion rate to see if people are sticking around.
- Drive traffic or sales: Keep an eye on link clicks (if you have a link in bio) and video views by traffic source to see how people are finding you.
Once your goals are set, the right metrics become obvious.
See what works
Once your goals are set, you can dig into your analytics to find your best-performing content.
Look for:
- Top posts: Which videos have the most views, shares, or saves?
- Average watch time (a big one for the algorithm): Are people watching to the end or dropping off early?
- Engagement rate: Which posts spark conversation or get the most comments?
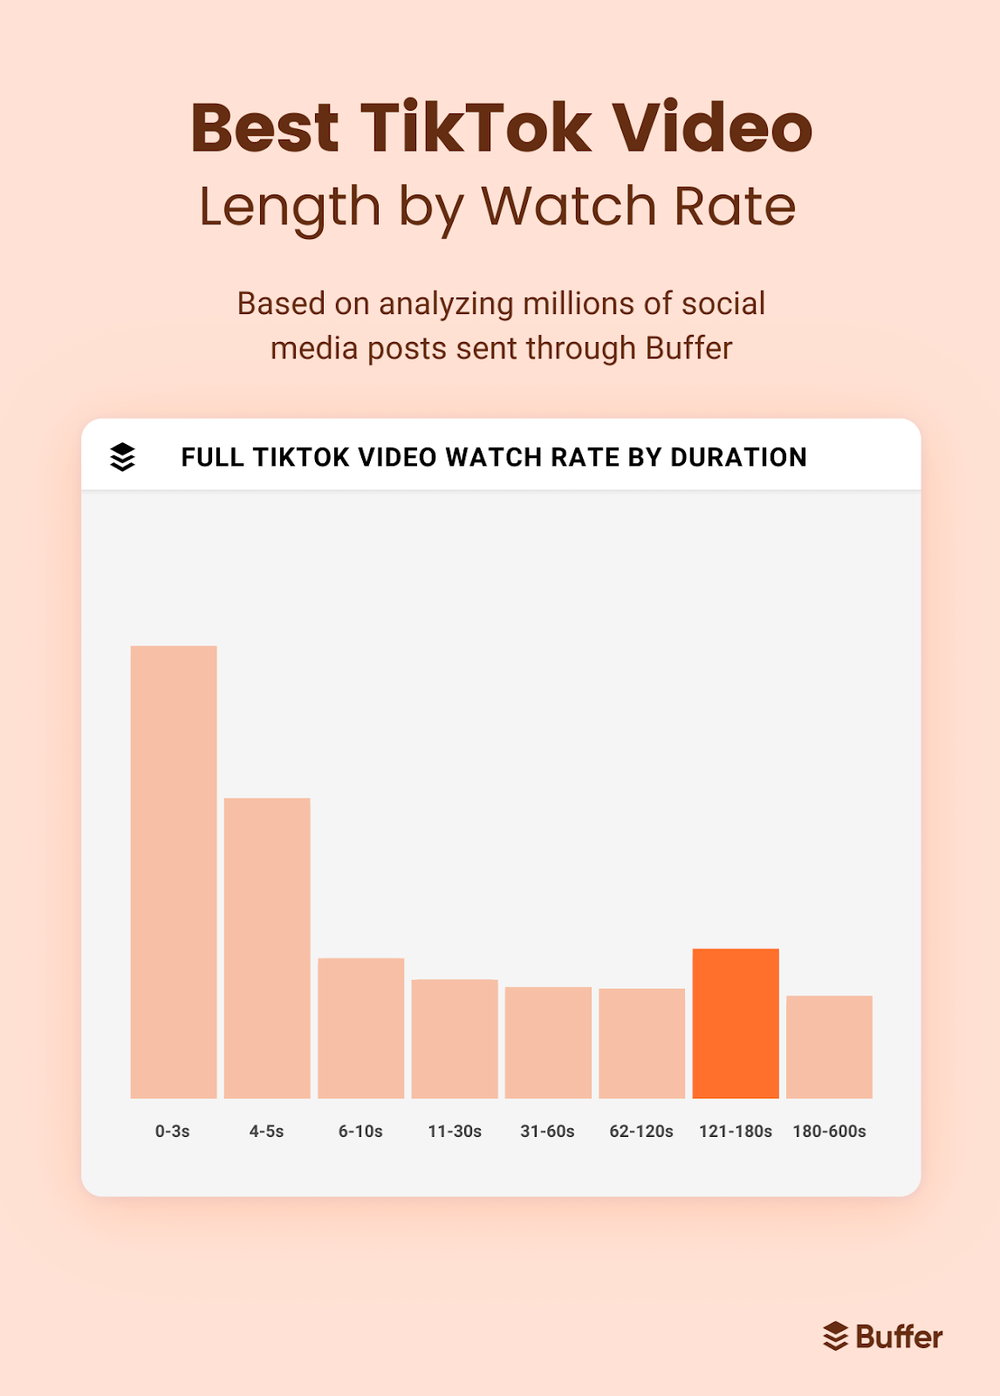
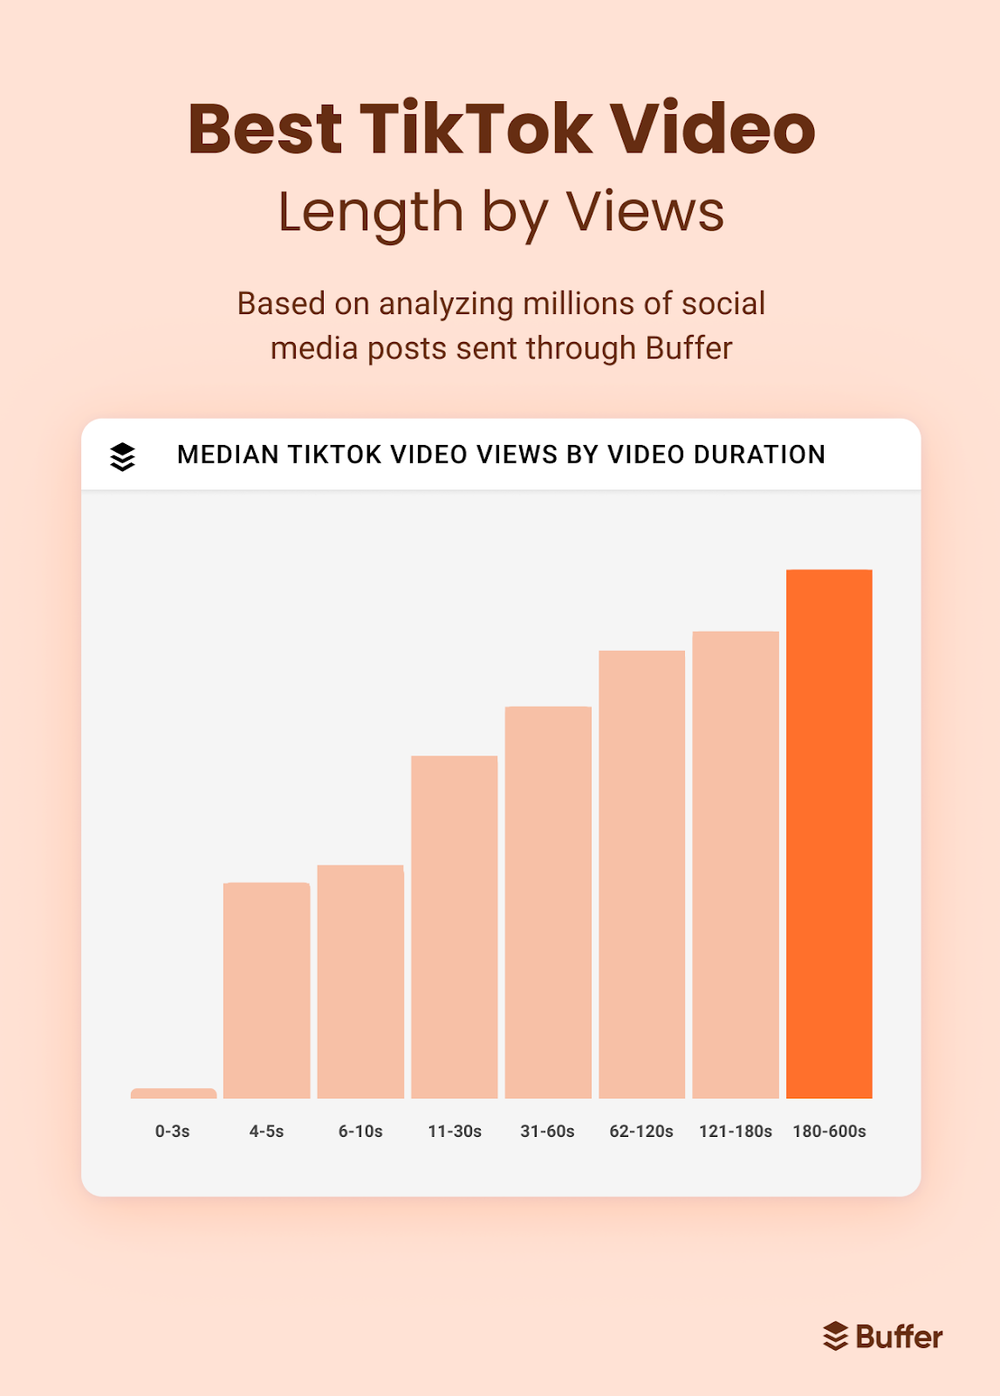
Pro tip: According to our latest data, videos between three and 10 minutes long now perform better than super short ones in terms of engagement and watch time. (That said, this advice only applies if videos of this length are relevant to your brand, context, and content.)
Understand your audience
Analytics tell you what’s working and who it’s working for. Use the dashboard to identify:
- Demographics: Age, gender, and top territories.
- Activity patterns: Specific hours and days when your followers are most active.
- Growth trends: Net follower changes over specific timeframes.
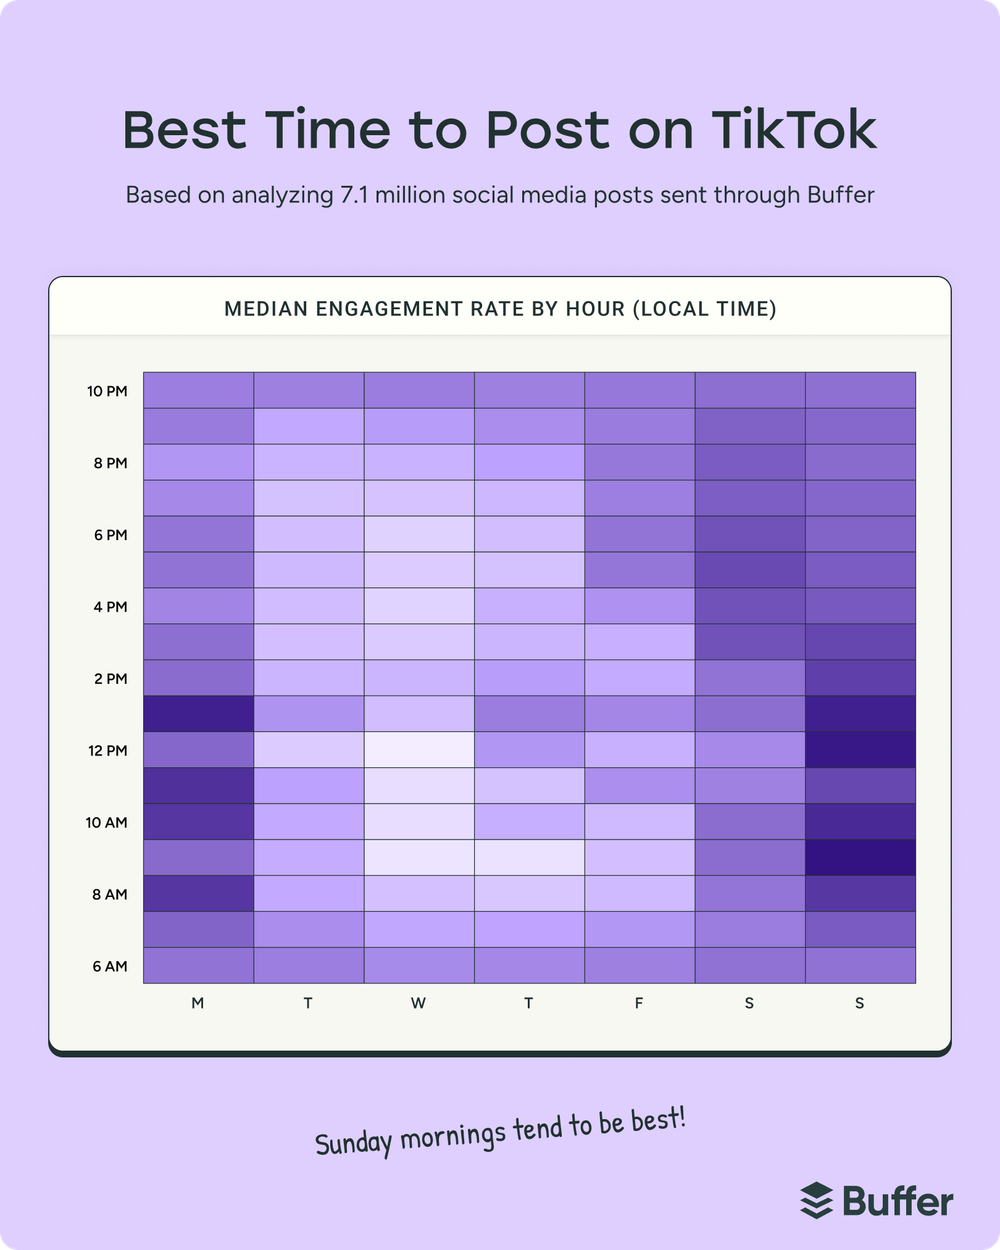
Pro tip: Our data shows that posting during evening hours (6 p.m.–11 p.m.) is best for engagement. Does that align with your stats? It might not, and that’s OK. The whole reason to look at your own analytics is to see what’s resonating with your specific audience.
Spot patterns
It’s such a boost to see a video taking off, and you deserve every celebration. But often, the real optimization magic happens when you zoom out. Instead of solely focusing on individual posts, start noticing trends in your content.
- What themes, tones, or topics consistently perform well?
- Do certain posting times get better results?
- Are your strongest videos short, funny, educational, or emotional?
- Have there been any shifts in your audience demographic over time?
Test and learn
Stay curious and adapt to the changing algorithm by testing these variables:
- Hooks: Try different opening lines or visuals in the first three seconds.
- Formats: Alternate between educational, entertaining, and trending content.
- Timing: Shift posting times slightly to find your unique "sweet spot."
TikTok analytics made actionable
TikTok analytics help you understand what works, who’s watching, and how to improve your content. Now that you know where to look and what to look for, you’re in a much better position to make content that resonates and reaches the people you’re trying to connect with.
The key is to treat your analytics as an ongoing feedback loop, not a one-time check. Review your numbers regularly, spot the patterns, and let the data guide your next creative decision. If you'd like to keep all your TikTok metrics (and the rest of your social channels) in one place, Buffer Insights can help with that.
FAQ about TikTok analytics
How do I see my analytics on TikTok?
On mobile, go to your profile and tap the TikTok Studio button right below your bio, then tap Analytics. On desktop, head to tiktok.com/analytics.
What does "Other" mean on TikTok analytics?
If you see “Other” as a traffic source, it typically includes sources that don’t fit neatly into TikTok’s main categories. It could be viewers who found your video through shared links, embeds, or external sites.
How do I see TikTok follower analytics?
Head to the Followers tab within your analytics dashboard. There, you’ll see breakdowns of your audience’s gender, top territories, and when they’re most active. This is one of the best places to refine your posting schedule and ensure your content lands when your community is online.
How do I set up analytics on TikTok?
Analytics are available to all Creator and Business accounts. If you’'re using a personal account, just switch in Settings and privacy → Account → Switch to Business Account (or Creator). Once you've switched, you'll have access right away — though some features, like the Followers tab, require at least 100 followers before data starts showing up.
How do I turn analytics off on TikTok?
If you’d prefer not to track analytics, simply switch back to a personal account. Tap Settings and privacy → Account → Switch to personal account. Just note that you’ll lose access to insights and certain business tools, so only switch if you’re sure you don’t need them.
What time do TikTok analytics update?
Analytics data may take some time to update, so don't expect every metric to appear immediately after posting. You might notice a delay of several hours before new performance data (like views or engagement) fully updates. For the most accurate picture, check your analytics at the same time each day and give new posts at least 24 hours before analyzing performance.
Does TikTok analytics show who viewed your profile?
TikTok analytics shows your total profile views, but analytics itself doesn't provide a list of everyone who viewed your profile. TikTok also has a separate Profile view history feature with its own eligibility and privacy settings.
How many followers do you need to see TikTok analytics?
You don't need a minimum follower count to access TikTok analytics. It's available on all Creator and Business accounts from day one. That said, the Followers tab won't display detailed audience data until you have at least 100 followers.
Is 20K views on TikTok a lot?
It depends on your account size and niche. For a newer account, 20K views is a strong result. For a large, established account, it might be below your usual average.
Rather than comparing your numbers to other creators, use your own analytics to track view trends over time. Consistent growth in your own data is a much better signal that your content is on the right track.
More TikTok resources
- TikTok Marketing: The Complete Guide to Form Your Strategy (For Creators and Brands)
- Top 250 TikTok Hashtags + How to Use Them for Growth
- 14 Ways to Get More Followers on TikTok — Tried and Tested
- The 11 Best AI Video Editors for Creators and Marketers, Tried and Tested (+ Bonus AI Tool)
- The Best Time to Post on TikTok
Try Buffer for free
200,000+ creators, small businesses, and marketers use Buffer to grow their audiences every month.